6 years of Demonetisation: Digital transactions in India continue to rise, yet 44% of those who bought a property reveal cash was part of the transaction
- ● 76% of those who use cash use it for groceries, eating out and food delivery
- ● Other common areas of cash usage include home repairs, beauty services, etc.
November 08, 2022, New Delhi: Six years after demonetization of high value currency to weed out black money in circulation and check the growth of the parallel economy, the verdict is still not clear whether this gigantic step has indeed delivered its set goal. Anecdotal evidence reveals that people are still paying or accepting black money in real estate transactions. People are still selling and buying products like hardware, paints and many other household and office paraphernalia and also delivering services without proper receipts. At the same time, it is true that in the last six years more people have adopted the digital payment mode. This shift gathered pace during the pandemic when most people were housebound and had to rely on online purchases and other transactions.
After a lot of dialogue by consumers on the subject of use of cash in daily life and black money generation as they go about their spending and transactions, LocalCircles conducted its 6th year survey since demonetization to better understand use of cash. The survey received over 32,000 responses from citizens located in 342 districts of India. 68% respondents were men while 32% respondents were women. 44% respondents were from tier 1, 34% from tier 2 and 22% respondents were from tier 3, 4 and rural districts.
44% of those surveyed who bought a property in the last 7 years said cash was part of the transaction
Property transactions emerged as the top area of cash usage from a value per transaction standpoint in the 2021 survey. So the first survey question asked respondents “When you or your family bought a property (land, house, flat, shop, office, others) in the last 7 years, on an average what percentage of the value had to be paid in cash?” The responses revealed that 8% of the 11,499 respondents to the query had paid over 50% in cash. Of the remaining, a whopping 35% refused to divulge; 21% claimed they had paid no cash during the transaction; 15% had paid between 30-50% of the transaction in cash; 13% had paid 10-30% cash and the remaining 8% had paid up to 10% of the value in cash. The situation may look to have improved compared to the LocalCircles survey in November 2021 when 70% of the respondents had admitted to paying cash as part of the transaction for property acquired in the previous 7 years. One encouraging sign is that as against 16% who admitted to having paid over half of the amount in cash in 2021, the new survey reveals that the percentage of such cases has dropped to 8% in the new survey. However, the fact that 35% did not divulge the mode of transaction must also be taken into account. It is safe to assume that many of these individuals did pay some cash in the transaction(s) they conducted but they are not comfortable disclosing the same.

Unfortunately, property transactions is one area where there have been literally zero reforms so bribery is also rampant. The original transaction of the land or property continues to be sizably in cash as property owners want to avoid paying full taxes involved in the deal.
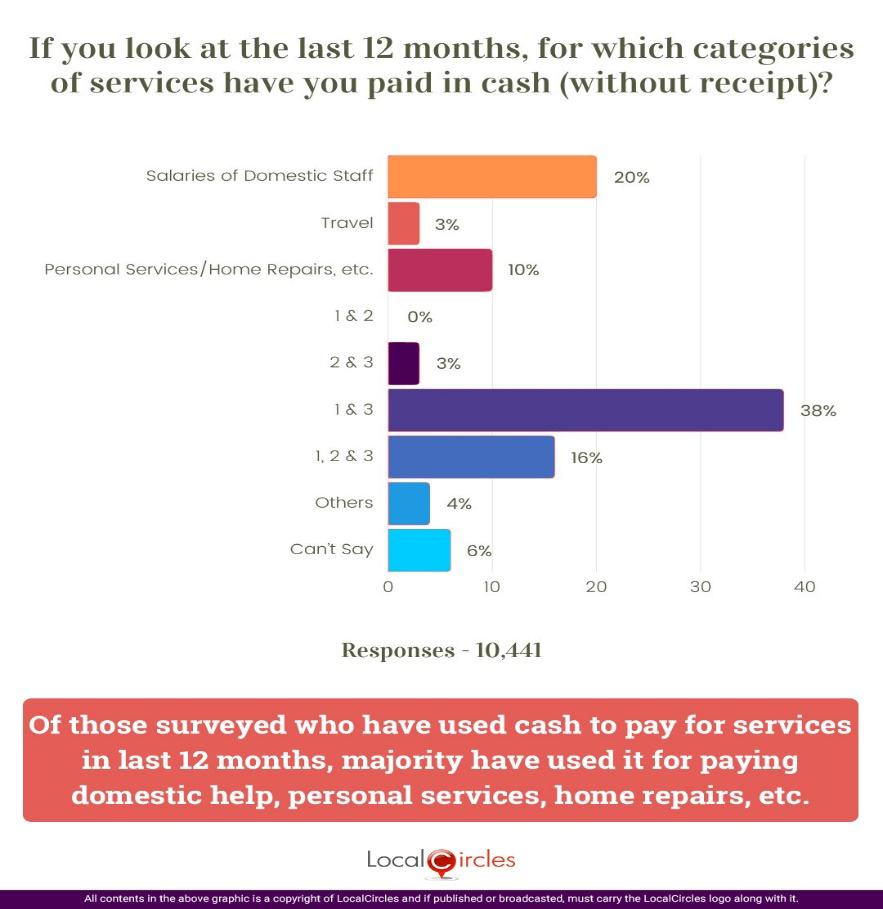
Most households surveyed say paying cash for domestic and personal services and for home repairs, etc.
One of the other areas where cash use was reported to be high by people in the 2021 survey was for home repairs, salaries of household staff, beauty services, etc. Respondents were asked in the 2022 survey, “In the last 12 months, for which categories of services have you paid in cash (without receipt)?” In response, 20% pointed to salaries of domestic staff (category 1); 3% for travel expenses (category 2); 10% for personal services/ home repairs, etc. (category 3). In addition, 38% of the 10,441 respondents to the question pointed to categories 1&3; 3% to categories 2&3; 16% to all the three categories; 4% to undefined categories; and remaining 6% gave no clear response. The survey reveals that most people have been paying cash for domestic staff services, personal services and for home repairs, etc.

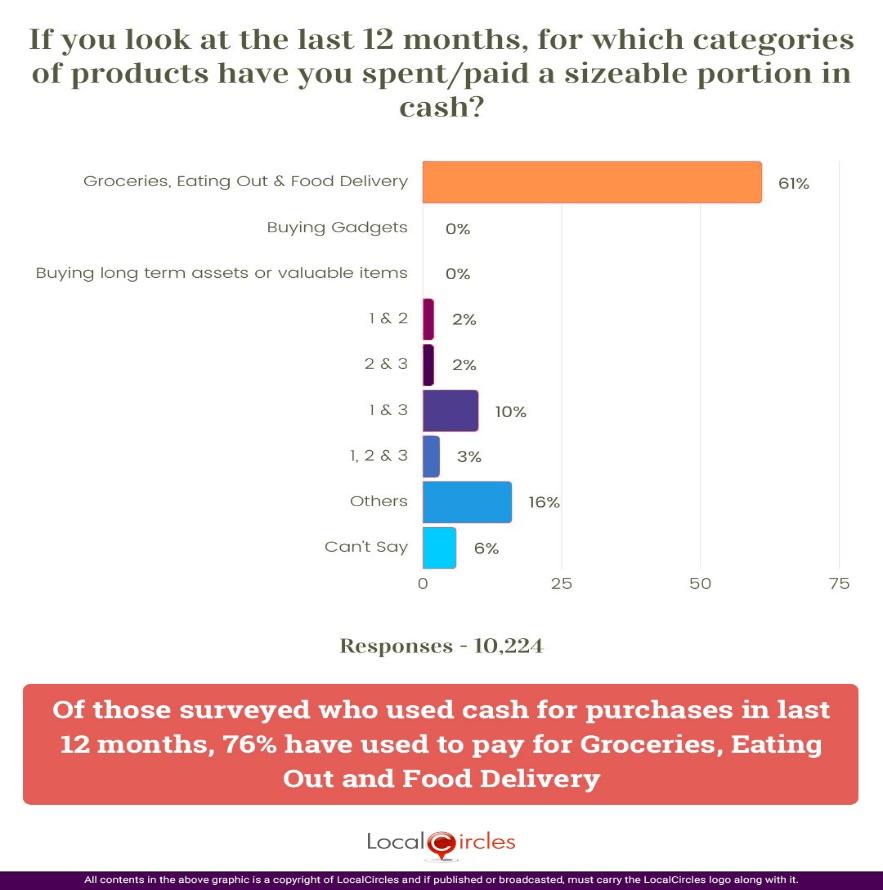
76% households surveyed say they used cash for groceries, eating out and food delivery transactions in the last 12 months
The final question in the survey focused on understanding what are the other expenditures/ transactions beyond services where most people were still using cash. It asked respondents, “In the last 12 months, for which categories of products have you spent/ paid a sizable portion in cash?” Out of 10,224 respondents to this query, 62% pointed to groceries, eating out and food deliveries (category 1). Individually there were no positive responses to the categories – buying gadgets (2) and long term assets or valuable items (3) but 2% of respondents indicated 1 & 2 categories; another 2% selected 2& 3 categories; 10% indicated 1&3 categories; 3% are using cash for all three categories; while 16% are using cash for unspecified expenses. This could raise questions as also in the case of 6% of respondents who opted not to give a clear indication. This survey question reveals that many are still to shift or adopt digital payment systems, maybe because it is more convenient to pay cash for purchase of fruits, vegetables or a few items of grocery from a store, or due to other reasons including voucher payment.

If the above 2 charts were to be summarised, top areas where most households surveyed used cash in the last 12 months are:
- Groceries, Eating Out & Food Delivery - 76%
- Salaries of Domestic Help - 74%
- Personal Services/Home Repairs, etc. - 67%
- Travel - 22%
- Buying long term assets or valuable items - 15%
- Buying Gadgets - 7%
- Other Products and Services - 20%
National Payments Corporation of India (NPCI) Managing Director and Chief Executive Officer Dilip Asbe at an official event in July stated that the overall universe of people using services like the Unified Payments Interface (UPI) is still 250 million or about a fifth of the population. "Unless we see one-third of the population on both demand and supply side having the digital payment structure, it is very difficult to start seeing some reduction in cash in circulation," Asbe said at the event organized by Bank of Baroda.
The Reserve Bank of India’s “State of the Economy” report released on September 16 points out that in August 2022, the digital payment ecosystem, spanning large-value and retail segments, continued to gain stride in volume and value terms (y-o-y). The Unified Payments Interface (UPI) sustained its run of record highs, with 658 crore transactions worth INR 10.73 lakh crore. Efforts toward expanding integration of the UPI beyond Indian borders are expected to turbocharge this growth momentum. The lowering of average monthly transaction values of the UPI and the Prepaid Payment Instruments (PPI-mobile wallets) suggest a growing shift towards retail digital modes for serving small-value transactional needs.
If one goes by the latest published figures in 2022, over INR 31 lakh crore worth of notes are in circulation even as digital payments are rising. A survey by the Reserve Bank of India (RBI) itself suggests that despite the increase in use of digital payments in India, a large section of people still prefer cash over digital payments. The central bank report based on feedback from people from different cities found around 54% of the total preferred making cash payments. There are multiple reasons why a number of people continue to prefer and demand cash. And not all of them are reasons of practicality or usage. Instead, the reasons are more personal, such as the immediacy and feel of money, or the difficulties of accepting and enabling digital payments.
In summary, as India marks 6th anniversary of demonetization, what is apparent is that the UPI and digital payments have taken off and a large section of the urban India households are using this mode of payment much more than they did before 2016. However, 44% of those surveyed, who bought a property in the last 7 years, have shared that they had to pay a component in cash is something worth noting. It serves as a reminder to the Government that black money and cash and property transactions go hand in hand. Until and unless reforms are undertaken in this area not much will change. As far as daily life goes, home repairs i.e. buying products and hiring contractors for the job is largely being done in cash and so are payment of salaries to household help and services like beauty treatment, etc. As far as areas where most people are using cash is concerned, it is for grocery shopping, eating out, paying for food deliveries, etc. These transactions appear to top the list largely because cash makes it fast and convenient to do so with not everyone having the tools or desire to do cash digital transactions for small amounts.
Survey Demographics
The survey received over 32,000 responses from citizens located in 342 districts of India. 68% respondents were men while 32% respondents were women. 44% respondents were from tier 1, 34% from tier 2 and 22% respondents were from tier 3, 4 and rural districts. The survey was conducted via LocalCircles platform and all participants were validated citizens who had to be registered with LocalCircles to participate in this survey.
About LocalCircles
LocalCircles, India’s leading Community Social Media platform enables citizens and small businesses to escalate issues for policy and enforcement interventions and enables Government to make policies that are citizen and small business centric. LocalCircles is also India’s # 1 pollster on issues of governance, public and consumer interest. More about LocalCircles can be found on https://www.localcircles.com
For more queries - media@localcircles.com, +91-8585909866
All content in this report is a copyright of LocalCircles. Any reproduction or redistribution of the graphics or the data therein requires the LocalCircles logo to be carried along with it. In case any violation is observed LocalCircles reserves the right to take legal action.
Enter your email & mobile number and we will send you the instructions.
Note - The email can sometime gets delivered to the spam folder, so the instruction will be send to your mobile as well


